Dashboard
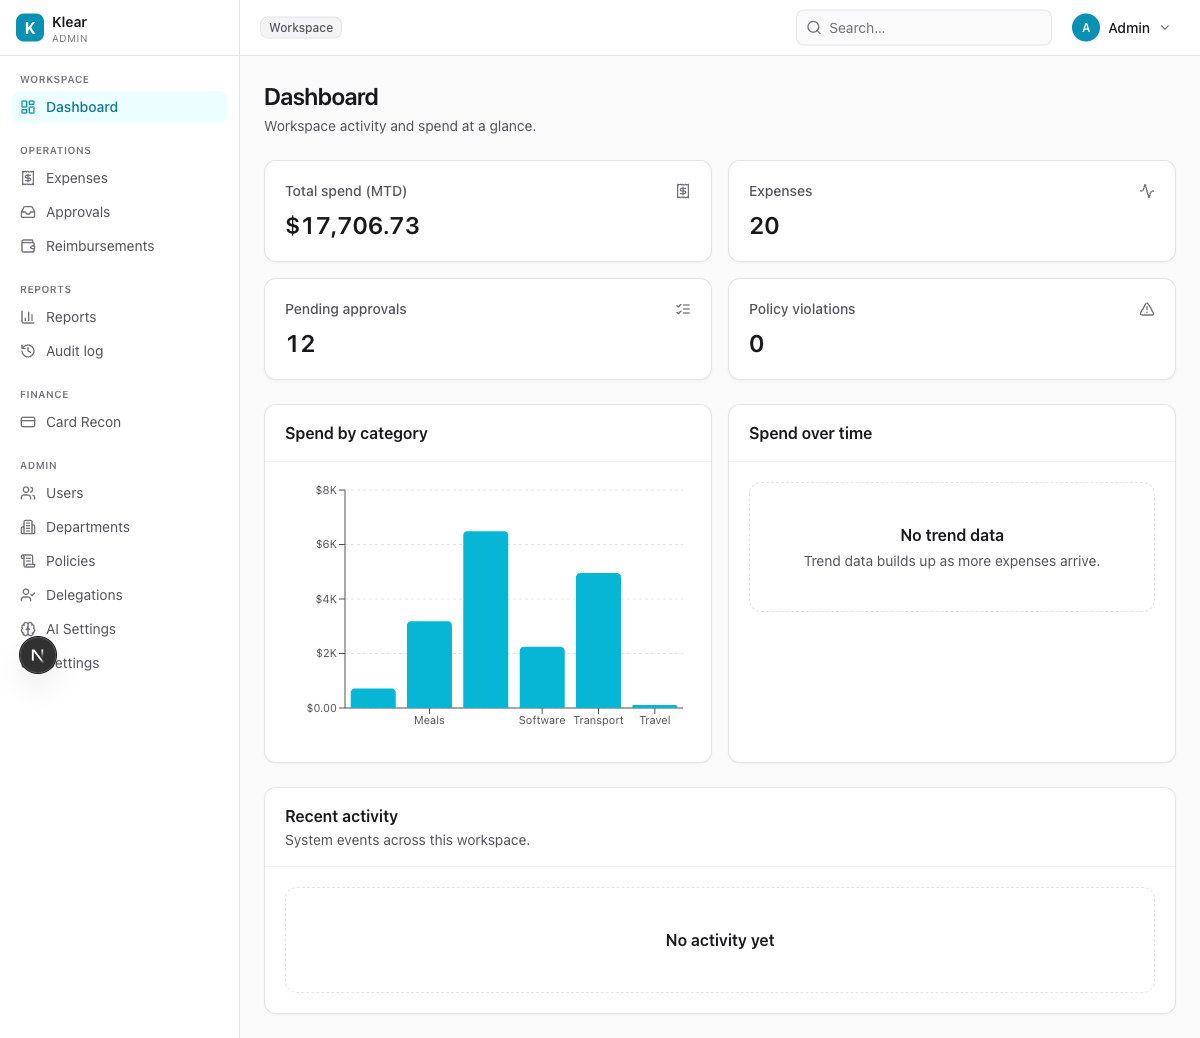
The Dashboard gives a real-time snapshot of workspace activity. It is the first page you see after logging in to the Admin app.
Summary cards
| Card | What it shows |
|---|---|
| Total spend (MTD) | Sum of all approved + paid expenses this calendar month |
| Expenses | Total number of expense records in the workspace |
| Pending approvals | Expenses currently waiting for an approver's decision |
| Policy violations | Active hard-block violations across all pending expenses |
Charts
Spend by category — Bar chart of total approved spend grouped by expense category (Meals, Travel, Software, etc.). Useful for spotting over-budget areas at a glance.
Spend over time — Line chart of daily spend. Populates as more approved expenses accumulate.
Recent activity
A chronological feed of system events across the workspace — expense submissions, approval decisions, policy changes, and user actions.
info
The audit trail is more detailed than Recent Activity. For compliance and forensic use, go to Audit log.